




BLACK FRIDAY
SALE IS LIVE
50% OFF
On All ReachStream Products
Limited time · Ends Nov 30, 2026
Ends Nov 30
total addressable market (TAM) for b2b
Written by:
Mohammed Younus

Total Addressable Market (TAM): A Guide for B2B Sales Teams

How B2B teams size their market with TAM, SAM and SOM

Key takeaways lightning icon
TL;DR

What Is Total Addressable Market (TAM) for B2B?

Total addressable market (TAM) is the total revenue available if every fitting company bought your product. Total addressable market (TAM) for B2B is the total yearly revenue your company could earn if every business that fits your product bought it.
In simple, it answers how big the prize is before you plan territories, quotas or hiring. For B2B sales leaders, it is also a count of accounts: how many companies match your offer, and what each one could be worth.

How to Calculate TAM for B2B: Top-Down or Bottom-Up?

There are two main methods, and most total addressable market B2B guides cover both. Top-down starts with a large market figure from industry reports and narrows it to your segment. Bottom-up starts with your own accounts: count the companies that match your ICP and multiply by what each would pay. Most B2B teams trust bottom-up more, because it rests on real accounts rather than a slice of a report.

The total addressable market formula for bottom-up is simple: number of target accounts multiplied by average annual contract value. Say 12,000 companies fit your ICP and a typical deal is worth $15,000 a year. That gives a market of $180 million. These numbers are assumptions for illustration, so replace them with your own. A careful TAM calculation separates new accounts from ones you already serve.

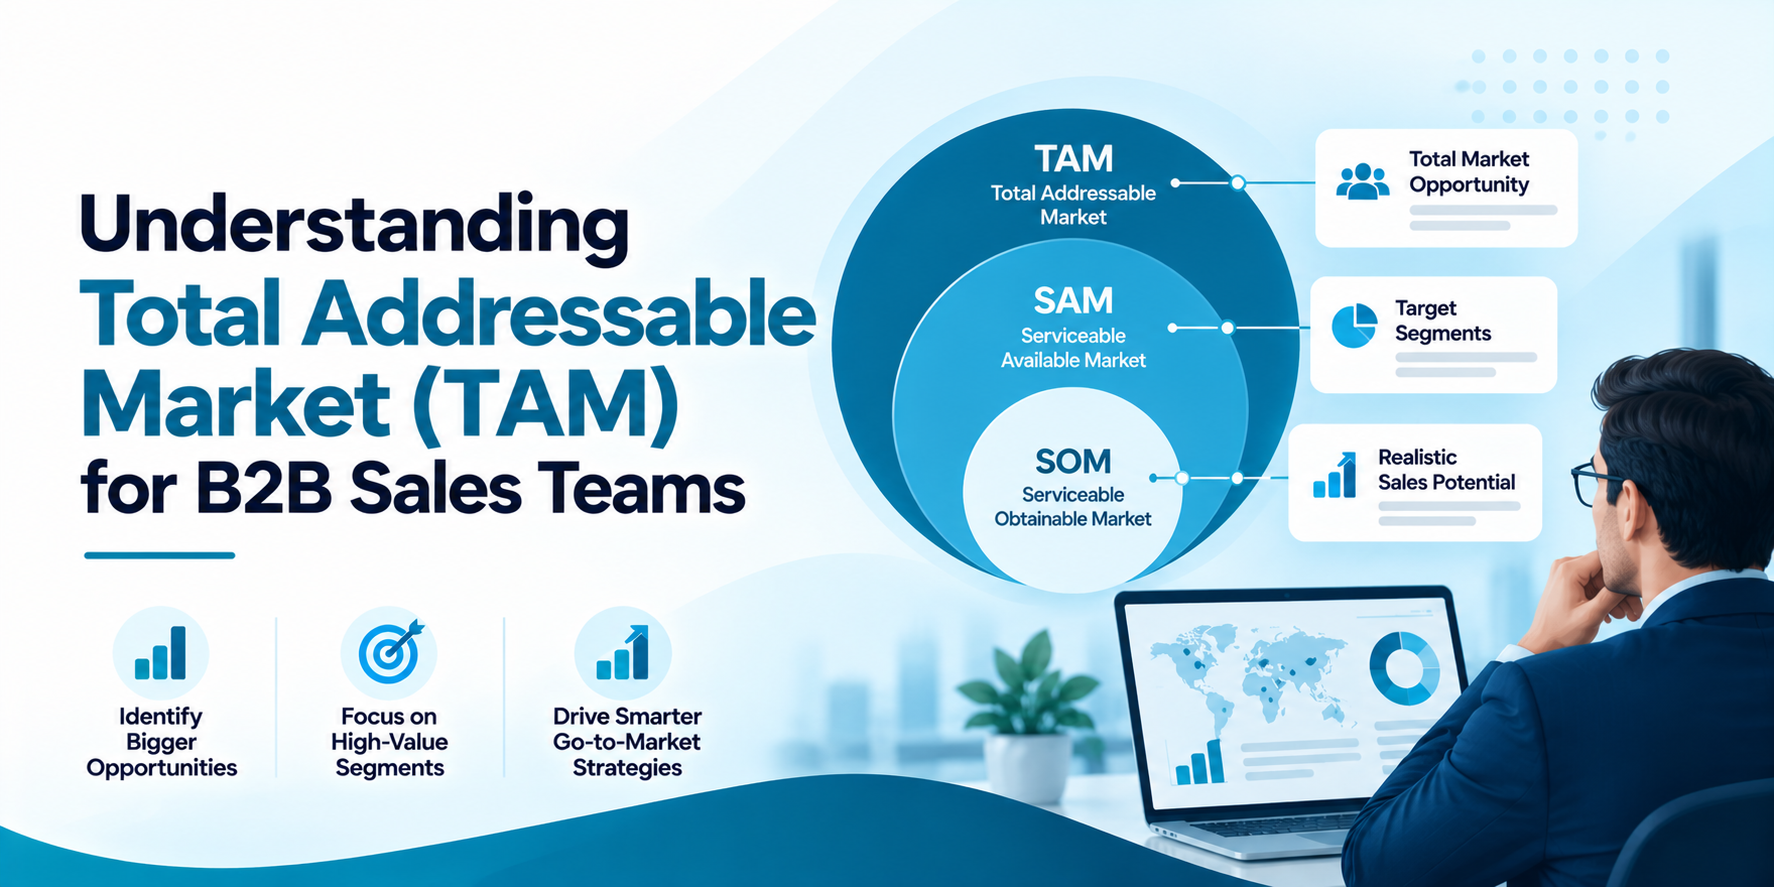
TAM SAM SOM for B2B Explained

TAM SAM SOM for B2B is a three-layer view of one market. TAM is everyone who could buy. SAM narrows it to the accounts you can serve today, based on region, company size, language, compliance and product fit. SOM narrows it again to what you can win, given your team size, sales cycle and competition.

Continue the scenario: if 40% of the 12,000 accounts sit in regions and sizes you serve, SAM is 4,800 accounts, or $72 million. If you can realistically win 5% of SAM this year, SOM is 240 accounts, or $3.6 million. SOM, not TAM, should set quotas. This is where B2B market sizing meets planning, because each layer links to a different decision, from product scope to headcount.

What Data Do You Need for Market Sizing?

You need three inputs to size total addressable market for B2B work. First, a count of target accounts, which comes from company data filtered by industry, size and location. Second, a price point, taken from your average contract value. Third, a view of who already buys. Industry market analysis and public reports help with the top-down check, but they rarely match your exact segment.

Good B2B market research methods mix sources: your CRM, company databases, industry associations, public filings and customer interviews. Use firmographic data such as industry, employee count and region to define each segment. Our guide to ICP refinement shows how to turn customer results into filters you can count.

How Do You Count Potential B2B Customers?

Counting potential customers is where B2B market size estimation usually goes wrong. Start with a filtered list: industry, company size, location and, if your product depends on a stack, technologies used. Count the companies that match, then sample 50 of them by hand to check fit. If 40 of 50 are real fits, apply an 80% fit rate to the full count.

A company database can speed this up. ReachStream filters by industry, job title, seniority, location, company size and technologies used, so you can gauge how many companies match each segment. Counts depend on coverage in your market, so cross-check against a second source. Our guide to how to build a targeted prospect list walks through the filters.

How Does Your ICP Change the Number?

The ideal customer profile and TAM are linked: a tight ICP shrinks your B2B total addressable market, and a loose one inflates it. If your ICP says mid-sized software companies in North America, only those count. Adding retail or manufacturing makes the market larger but may lower win rates, so the bigger number is not always better.

B2B target market analysis helps you decide which segments to include by comparing deal size, sales cycle and retention. Target account identification comes next. Once the ICP is set, list the named accounts and the roles that buy. Our ICP worksheet template helps you capture the criteria, and our guide to finding decision-makers in your target industry covers the buying group.

Size your market with ReachStream
Filter by industry, size and location to size your segments.

How Do the TAM Methods Compare?

The table compares the common ways to size total addressable market for B2B. Most teams combine two methods and check them against each other.

Method How it works Strength Watch-outs Best for
Top-down
Start from a report and narrow by segment
Fast and easy to explain
Depends on report quality
Early planning and investor talks
Bottom-up
Count target accounts times deal value
Rooted in real accounts
Needs good company data
Quotas and territory design
Value-based
Estimate what each account would pay for the value delivered
Reflects pricing power
Needs customer evidence
New products and pricing

How Do You Size a Market Step by Step?

  1. Define the ICP: Write the industry, size and region you sell to.
  2. Count accounts: Filter company data and sample for fit.
  3. Set deal value: Use your average annual contract value.
  4. Calculate TAM: Multiply accounts by deal value.
  5. Narrow to SAM: Remove accounts you cannot serve.
  6. Estimate SOM: Apply a realistic win rate. 

What Mistakes Inflate Market Size Estimates?

The most common mistake is counting every company in an industry rather than those that fit your ICP, which inflates total addressable market for B2B estimates. Others include using one price for all segments, ignoring accounts you cannot serve and mixing yearly values. Market penetration also gets missed: if you already serve 10% of target accounts, your remaining market is smaller than TAM suggests.

A B2B market opportunity analysis should also test timing. A large market with long sales cycles may produce less revenue in a year than a smaller, faster one. Our guide to qualifying B2B leads shows how to separate accounts that fit from ones that merely exist.

How Do You Use TAM After You Size It?

  1. Set quotas: Base targets on SOM, not TAM.
  2. Plan territories: Split SAM accounts by region and rep.
  3. Choose segments: Rank segments by size and win rate.
  4. Plan hiring: Match headcount to reachable accounts.
  5. Guide marketing: Focus campaigns on named target accounts.
  6. Review yearly: Refresh the count as companies change.

How Can ReachStream Help With Sizing?

When estimating your total addressable market (TAM), ReachStream Prospect can help you identify and segment potential B2B customers. Its database includes 500M+ contacts, 50M+ companies, and 60M+ direct-dial numbers. You can narrow your search using filters such as industry, job title, seniority, location, company size, and technologies used to build targeted account lists that align with your ideal customer profile .

Features such as dynamic lists, email verification, data enrichment, CSV exports, ReachAPI, and Salesforce and HubSpot integrations can help teams organize prospect data and incorporate it into their existing workflows.

However, contact database size alone does not determine TAM. For a more reliable estimate, define your target market, identify eligible companies, and validate your assumptions against independent sources. Since data coverage varies by region and role, test your key searches using ReachStream’s Free plan before committing to a paid subscription. Explore the platform on the ReachStream Prospect page.

Start with 100 free export credits a month
No credit card needed. Test your segments against real company data.

TAM for B2B: The Short Version

The short version: total addressable market for B2B is the yearly revenue available if every fitting company bought from you. Build it bottom-up from your ICP, split it into TAM, SAM and SOM and base quotas on SOM. For your next read, see our guide to B2B list building and our guide to ABM with ReachStream.

Find a plan that fits your team size

Compare ReachStream’s Free, Starter, Pro, Business and Enterprise plans.

Frequently Asked Questions

1. What is total addressable market in B2B?

Total addressable market in B2B is the total yearly revenue available if every company that fits your product became a customer. It is usually shown in currency and also as a count of target accounts. It sets the upper limit for growth planning.
Multiply the number of companies that fit your ICP by your average annual contract value. You can cross-check with a top-down figure from industry reports. Document your assumptions so others can review and update them.
TAM is the full market, SAM is the part you can serve with your current product, regions and pricing, and SOM is the share you can realistically win in a set period. Each one is smaller than the last. SOM is the best basis for quotas.
TAM shows whether a market is big enough to justify investment in product, hiring and marketing. It also helps leaders compare segments and explain the opportunity to a board or investors. A clear TAM keeps planning grounded in real accounts.
You need a count of target accounts, an average contract value and a view of existing customers. Firmographic data such as industry, size and region defines each segment. CRM records, company databases and industry reports supply the inputs.
Filter company data by your ICP, count the matches and sample around 50 by hand to test fit. Apply that fit rate to the full count. Check the result against a second data source.
Top-down starts with a published market figure and narrows it by segment, while bottom-up counts your own target accounts and multiplies by deal value. Top-down is faster, and bottom-up is usually easier to defend. Many teams use both to cross-check.
The ICP decides which companies count. A tight ICP gives a smaller but more accurate TAM, while a broad one inflates the number. Refine the ICP with customer results before you count.
Mohammed Younus
Mohammed Younus

Author

Mohammed Younus

Mohammed is Senior Manager of Business Operations at ReachStream, with a keen insight into the B2B landscape. Through his articles, he shares practical tactics for sales and marketing professionals.

Share
Table of Contents
Access 500M+ verified business emails and grow your sales pipeline effortlessly.
Power Your Sales with Targeted Data
Mohammed Younus
Mohammed YounusAuthor
Mohammed Younus is the Senior Manager of Business Operations with a keen insight into the B2B landscape. Through his contributions to this blog, he aims to share cutting-edge tactics and insights that empower sales and marketing professionals to achieve unparalleled success.

Don't forget to share this post!

Check out our other blogs!