
TL;DR
- B2B lead generation KPIs turn raw lead counts into a measurable pipeline that ties back to revenue instead of vanity metrics.
- Lead Velocity Rate (LVR) tracks month-over-month growth in qualified leads and is one of the earliest signals of pipeline health.
- MQL-to-SQL conversion rate shows whether marketing and sales agree on what counts as a qualified lead.
- Cost Per Lead (CPL) and Customer Acquisition Cost (CAC) measure efficiency, not just volume, and both are worth tracking by channel.
- Pipeline velocity combines opportunity count, deal size, win rate, and sales cycle length into a single formula for how fast revenue moves.
- Multi-touch attribution models are increasingly used alongside single-touch tracking as more B2B buying committees research before ever contacting sales.
- A working KPI dashboard usually means five to ten metrics on one page, reviewed on a set cadence, with one person responsible for each number.
What Are B2B Lead Generation KPIs?
B2B lead generation KPIs are the clear, measurable numbers that sales and marketing teams use to see if their lead generation is bringing in real revenue, not just activity. A metric is only a KPI when it has a target, a deadline, and someone responsible for it.
Most B2B teams need to look at more than just the number of leads. The best B2B lead generation KPIs focus on four things: how many leads you get, how efficiently you get them, how well those leads turn into customers, and how quickly deals move toward closing.
Tracking too many numbers is as common a failure as tracking too few for any B2B lead gen KPI program. The sections below cover the KPIs worth reporting on regularly, the formulas behind each one, and where 2026 benchmarks are landing across B2B SaaS and services.
Tip
Before you build a dashboard, agree on one written definition for each stage of your funnel: lead, MQL, SQL, opportunity, and customer. Most KPI disagreements between sales and marketing trace back to a definition nobody wrote down.
Which B2B Lead Generation KPIs Should You Track First?
You don’t need to track every KPI on your weekly dashboard. As your team grows, the most important metrics can change. Lead conversion rate 2026 benchmarks show lead conversion rates are usually between 10% and 15%, visitor-to-lead rates are often 1% to 3%, and lead-to-customer rates can be as low as 2% to 6%. The four categories below highlight the main B2B lead generation KPIs that most sales and marketing teams should focus on before moving to more advanced options. Teams running account-based programs should also watch Account-based marketing (ABM) KPIs, such as target-account engagement and account-level pipeline coverage, alongside these broader lead metrics.
Lead Volume and Cost Per Lead (CPL)
Lead volume is important, but it only tells part of the story. Cost Per Lead (CPL) is found by dividing your total marketing spend by the number of leads you get in a certain period. Recent Cost Per Lead (CPL) trends show a lot of variation across channels. Some sources say it ranges from $30 to $100, while others report it can be $3,000 or more, depending on the industry, channel, and how a team defines a qualified lead. It’s better to track CPL by each channel instead of using a single average, because a low-cost lead that never converts can end up being more expensive than a higher-cost lead that does.
MQL-to-SQL Conversion Rate
The MQL-to-SQL conversion rate shows what percentage of marketing qualified leads are accepted by sales as sales qualified. To find it, divide the number of SQLs by the number of MQLs, then multiply by 100. Benchmarks differ depending on the source, but a healthy range is usually between 10% and 18%.
This rate is often seen as the main way to measure how well marketing and sales work together. If your rate is consistently below this range, it usually means there is a mismatch in how leads are defined, not necessarily a problem with lead quality. How quickly you respond also matters: following up within five minutes instead of thirty can make a lead about 21 times more likely to qualify.
This rate is often seen as the main way to measure how well marketing and sales work together. If your rate is consistently below this range, it usually means there is a mismatch in how leads are defined, not necessarily a problem with lead quality. How quickly you respond also matters: following up within five minutes instead of thirty can make a lead about 21 times more likely to qualify.
Lead Velocity Rate (LVR)
Lead Velocity Rate (LVR) tracks month-over-month growth in qualified leads: ((current month qualified leads − prior month qualified leads) ÷ prior month qualified leads) × 100. As a leading indicator, LVR predicts revenue about one sales cycle before deals close. A commonly cited healthy target for LVR is 15% to 25% month-over-month growth, though the right number depends on your stage and market size.
Customer Acquisition Cost (CAC) and LTV:CAC Ratio
Customer Acquisition Cost (CAC) is the total amount spent on sales and marketing divided by the number of new customers gained during that time. When you compare CAC to Customer Lifetime Value (LTV), you get the LTV:CAC ratio. A 3:1 ratio is often seen as healthy. If it’s lower, you might be spending too much or charging too little. If it’s much higher, you could be missing out on growth by not investing enough.
Many B2B SaaS teams also look at the CAC payback period, which is how many months of gross profit it takes to earn back the CAC. A payback period of 12 months or less is usually considered strong.
Many B2B SaaS teams also look at the CAC payback period, which is how many months of gross profit it takes to earn back the CAC. A payback period of 12 months or less is usually considered strong.
INDUSTRY INSIGHT
Benchmarks also differ sharply by channel. Cold email tends to see 30% to 40% open rates and 5% to 10% reply rates, while email marketing overall is credited with an ROI as high as $36 to $42 per $1 spent, though a deliverability rate below 95% is usually a warning sign. On the paid side, a 3% to 5% click-through rate and a baseline 3x return on ad spend are common targets, and webinar attendance is often benchmarked around 50% or higher.
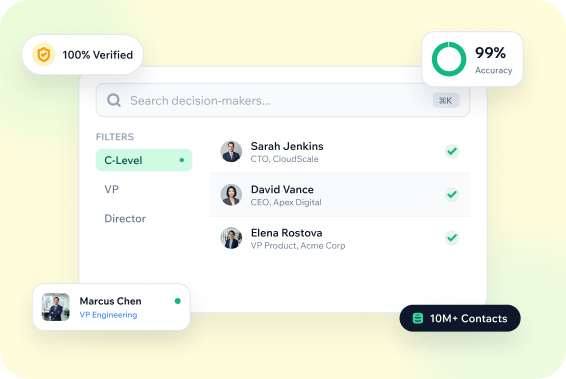
See What Verified B2B Contact Data Looks Like
KPIs like CPL, CAC, and MQL-to-SQL conversion rate are only as reliable as the contact data feeding them. Search real, verified company and contact records with filters built for how B2B sales and marketing teams actually work.
How Do You Calculate Pipeline Velocity and Marketing-Sourced Pipeline?
The Pipeline velocity formula shows how quickly revenue moves through your sales funnel. You calculate it by multiplying the number of opportunities, average deal size, and win rate, then dividing by the length of your sales cycle. If you improve any one of these factors by 10%, whether it’s more opportunities, a larger average deal, a higher win rate, or a shorter cycle, you’ll usually see a similar increase in overall velocity.
For B2B teams, win rates are often between 5% and 20%, and sales cycles can last from about two weeks to nine months or more, depending on the size and complexity of the deal.
Marketing-sourced pipeline, and its cousin, marketing-influenced pipeline, reports the dollar value of opportunities that marketing generated or touched. The two numbers can look very different depending on the attribution model you use, so pick one model, apply it consistently, and note it whenever you report the figure. Some dashboards label this same figure marketing influenced pipeline, so confirm which term a report is using before comparing numbers across teams.
TIP
If sales and marketing report different pipeline velocity numbers, check the attribution model before you assume the data is wrong. A single-touch model and a multi-touch model can produce meaningfully different marketing-sourced pipeline figures from the same underlying deals.
| KPI | What It Measures | Formula | 2026 Benchmark | Review Cadence |
|---|---|---|---|---|
|
Lead Velocity Rate (LVR) |
Month-over-month growth in qualified leads |
((Current month leads − prior month) ÷ prior month) × 100 |
15% to 25% monthly growth |
Weekly |
|
MQL-to-SQL Conversion Rate |
How well marketing and sales agree on lead quality |
(Number of SQLs ÷ Number of MQLs) × 100 |
10% to 20% |
Monthly |
|
Customer Acquisition Cost (CAC) |
Total cost to acquire one new customer |
Total sales and marketing spend ÷ new customers acquired |
LTV:CAC of 3:1 or higher |
Quarterly |
|
Cost Per Lead (CPL) |
Efficiency of your lead generation spend |
Total marketing spend ÷ number of leads generated |
\$30 to \$100 (varies widely by channel) |
Weekly |
|
Lead Volume |
Total number of leads generated in a given period |
Simple count of leads generated, tracked by channel |
Volume alone is not a reliable signal without CPL and conversion rate alongside it |
Weekly |
How Do You Build a B2B Lead Generation KPI Dashboard?
Use these five steps to build a working B2B lead generation KPIs dashboard:
- Pick one north star metric: Choose a single metric, often marketing-sourced pipeline or SQLs, that the whole team rallies around before adding anything else.
- Add three leading and three lagging indicators: Pair fast-moving numbers like LVR and CPL with outcome metrics like CAC and win rate so you can act before problems show up in revenue.
- Write down every definition: Document what counts as a lead, an MQL, and an SQL so marketing and sales are reporting on the same funnel.
- Assign one owner per metric: A KPI without a named owner tends to get reported but never acted on.
- Set a review cadence per metric type: Check activity metrics weekly, pipeline metrics monthly, and outcome metrics like CAC and NRR quarterly.
PRO TIP
Keep the dashboard to about five metrics on one page. A longer list usually means nobody is actually reviewing all of it on a consistent cadence.
How Often Should You Review Lead Gen KPIs?
You should review each metric as often as it changes. For example, activity and output metrics like number of leads and CPL are best checked every week. Pipeline metrics, such as MQL-to-SQL conversion rate and marketing-sourced pipeline, are usually fine to review monthly. Outcome metrics like CAC, LTV:CAC ratio, and net revenue retention change slowly, so looking at them once a quarter is usually enough. Checking these too often can add confusion instead of clarity.
QUICK CHECKLIST
- Does every KPI on the dashboard have a written definition and a named owner?
- Is the review cadence matched to how fast each metric actually changes?
- Are marketing and sales using the same attribution model for pipeline figures?
- Does the dashboard fit on one page without scrolling?
BEST PRACTICE
Revisit your KPI definitions every quarter, not just the numbers. Buying committees, channels, and attribution tools all change enough in a year that a definition set twelve months ago can quietly stop matching how deals actually close. It also helps to keep an eye on operational health metrics like email deliverability, healthy programs stay at 95% or higher, since a drop there quietly drags down every KPI downstream.
What Mistakes Should You Avoid With Lead Gen KPIs?
- Chasing lead volume without tracking cost: A rising lead count means little if CPL is climbing faster than pipeline value.
- Letting marketing and sales use different MQL definitions: Mismatched definitions are the most common reason MQL-to-SQL conversion rate looks broken when the leads themselves are fine.
- Reporting a single attribution model as the only truth: Marketing-sourced and marketing-influenced pipeline can differ significantly, so report both or be explicit about which one you are using.
- Reviewing every metric on the same cadence: Checking CAC weekly, or CPL only once a quarter, wastes attention on numbers that have not had time to move.
- Building a dashboard with no named owner per metric: A KPI nobody owns tends to get reported and then ignored.
PRO TIP
Audit your MQL-to-SQL conversion rate by lead source at least once a quarter. A blended number can hide a channel that is quietly underperforming, or one worth doubling down on.
Where ReachStream Prospect Fits In
Every B2B lead generation KPI on this page depends on accurate underlying contact data. A CPL calculation means little if a share of those leads bounce back with invalid emails, and CAC looks worse than it should when reps spend hours chasing contacts who changed roles months ago. ReachStream Prospect is designed to reduce that noise with verified company and contact records, so the KPIs you report reflect real pipeline activity rather than data quality problems.
Test Your Own Lead Gen KPI Baseline
Pull a sample of verified B2B contacts and compare bounce rates and reply rates against your current source before you commit to a full rollout.
Conclusion
B2B lead generation KPIs only earn their place on a dashboard when they are tied to a target, a cadence, and an owner. Start with a small set, Lead Velocity Rate, MQL-to-SQL conversion rate, CPL, CAC, and pipeline velocity, agree on the formulas and definitions across sales and marketing, and expand from there as your team and funnel mature.
Start Tracking KPIs on Reliable Data
See how ReachStream Prospect combines verified contacts, search filters, and enrichment to support the B2B lead generation KPIs your team already reports on.
Frequently Asked Questions
1. What are the most important B2B lead generation KPIs?
Most B2B teams start with lead volume, Cost Per Lead (CPL), MQL-to-SQL conversion rate, Customer Acquisition Cost (CAC), and pipeline velocity. These five cover volume, cost, quality, and speed, which together give a fuller picture than any single metric alone.
2. How is Lead Velocity Rate calculated?
Lead Velocity Rate (LVR) is calculated as ((current month qualified leads − prior month qualified leads) ÷ prior month qualified leads) × 100. A healthy range is often cited as 15% to 25% month-over-month growth, though the right target depends on company stage.
3. What is a good MQL-to-SQL conversion rate?
Published benchmarks vary by source, with healthy MQL-to-SQL conversion rate ranges cited anywhere from 10% to 18%. A rate that consistently falls below that range usually signals a mismatched definition of a qualified lead between marketing and sales, not necessarily a lead quality problem.
4. Marketing-sourced vs. marketing-influenced pipeline?
Marketing-sourced pipeline counts only opportunities that marketing generated from scratch. Marketing-influenced pipeline counts any opportunity marketing touched at any point, even if sales or another channel sourced it. The two numbers can differ substantially, so it helps to report both with the attribution model stated.
5. How often should B2B teams review lead generation KPIs?
Activity metrics like lead volume and CPL are worth reviewing weekly. Pipeline metrics such as MQL-to-SQL conversion rate work well monthly. Outcome metrics like CAC and LTV:CAC ratio move slowly enough that a quarterly review is usually sufficient.
6. What is a healthy LTV:CAC ratio for B2B companies?
A 3:1 LTV:CAC ratio is widely cited as a healthy target. A ratio below 3:1 can point to overspending or underpricing, while a ratio well above 5:1 can mean a company is underinvesting in growth.
7. How is Cost Per Lead (CPL) calculated?
Cost Per Lead is total marketing spend divided by the number of leads generated in a given period. Reported CPL ranges vary widely by industry and channel, so it is more useful to track CPL by channel than as one blended figure.
8. Why do sales and marketing pipeline numbers differ?
Different attribution models are the most common cause. A single-touch model credits one channel per deal, while a multi-touch model spreads credit across every touchpoint, and the two can produce meaningfully different marketing-sourced pipeline totals from the same set of deals.
9. How many KPIs belong on a lead gen dashboard?
Most working dashboards stay close to five to ten metrics: one north star metric plus a small set of leading and lagging indicators. Dashboards with far more than that tend to get reported without actually being reviewed.

Junaid Hussain Khan
Author
Junaid Hussain Khan

Junaid is Senior Manager – Brand Growth & Strategy at ReachStream, where he drives content, SEO, and growth strategy for B2B sales and marketing teams.
Share
Table of Contents
Access 200M+ verified business emails and grow your sales pipeline effortlessly.
Power Your Sales
with Targeted Data
Junaid Hussain Khan is the Business Development Manager at ReachStream, adept at forging strategic partnerships and identifying new market opportunities to propel ReachStream's growth and strengthen its position in the B2B ecosystem.
Don't forget to share this post!















Check out our other blogs!
How to Build a Targeted Prospect List Using Filters
October 21, 2026

B2B Data for Ed-Tech Companies: Reaching School Decision-Makers
October 21, 2026

Direct Dial Numbers Explained: A Guide for Sales Reps
October 19, 2026